
Accessing the Dashboard
From the main dashboard, select the LCS icon. If a Living Control Set has already been established for the client, you will be taken directly to the LCS Dashboard. The dashboard always reflects data from the latest iteration of the LCS engagement.
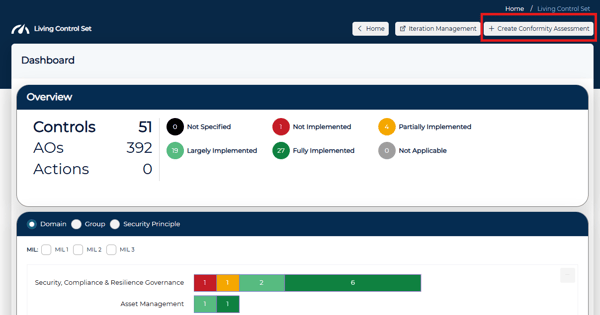
💡 The dashboard includes a Create Conformity Assessment button at the top of the screen. See Conformity Engagement for more information.
Overview Pane
The Overview Pane provides a high-level summary of your Living Control Set. It displays total counts for:
- Controls - the total number of controls in the LCS
- AOs - the total number of assessment objectives across all controls
- Action Items - the total number of action items across all controls
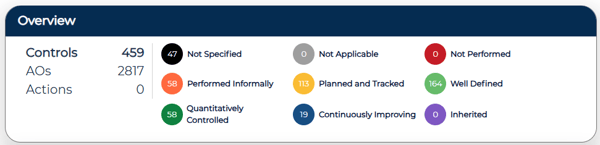
Each count is interactive. Selecting Controls or AOs shows how many fall under each implementation status. Selecting Actions shows how many are completed and how many remain outstanding.
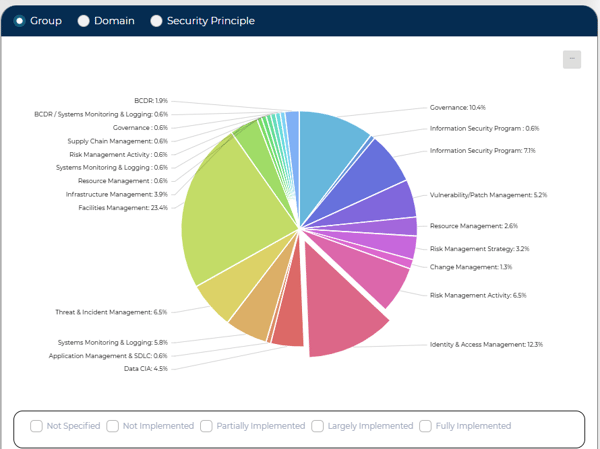
Graphs
The dashboard includes two interactive graphs that provide a visual representation of your control set status.
The Bar Graph defaults to Domain and shows your control data from the framework perspective, organized by how the framework itself is structured. Each bar is divided by implementation status, and the numbers at the bottom of each bar represent the total control count for that category.- Selecting a bar opens a window showing the controls within that status
- Selecting the edit pencil will navigate you to that control within the assessment
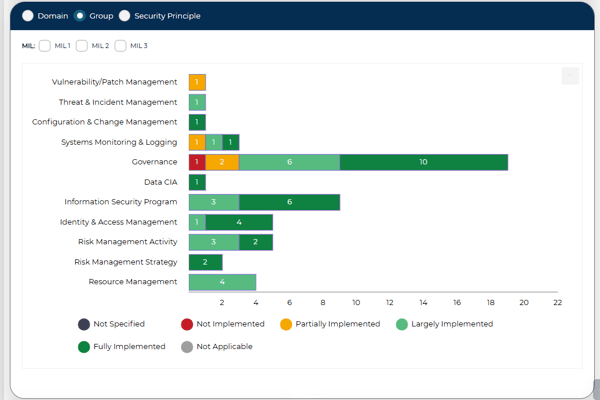
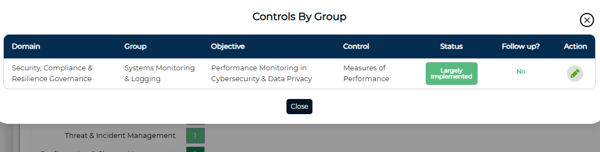
- Selecting a segment opens a window showing the controls within that grouping.
- Selecting the edit pencil will navigate you to that control within the assessment
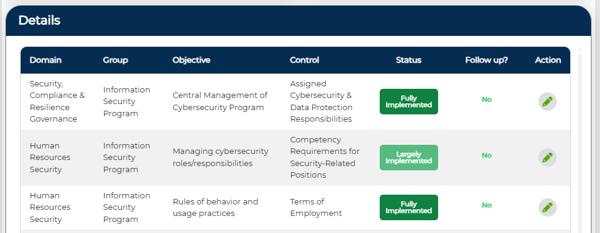
Controls Pane
The Controls Area displays all controls included in your Living Control Set. You can filter the list by Domain, Class and Implementation Status
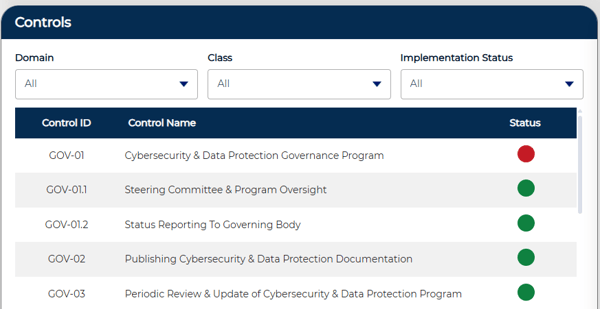
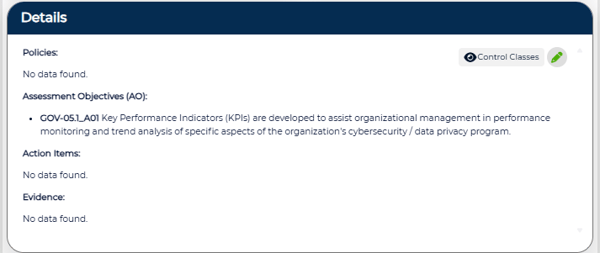
Selecting a control from the Controls Area loads it in the Details Pane below. Here you can view the associated Classes , Policies, AOs, Action Items and Evidence for the selected control.
Selecting the edit pencil will navigate you to that control within the assessment.
Related Articles